Chart Graph
Chart Types
| Chart Type | Description | Capabilities | Use Cases |
|---|---|---|---|
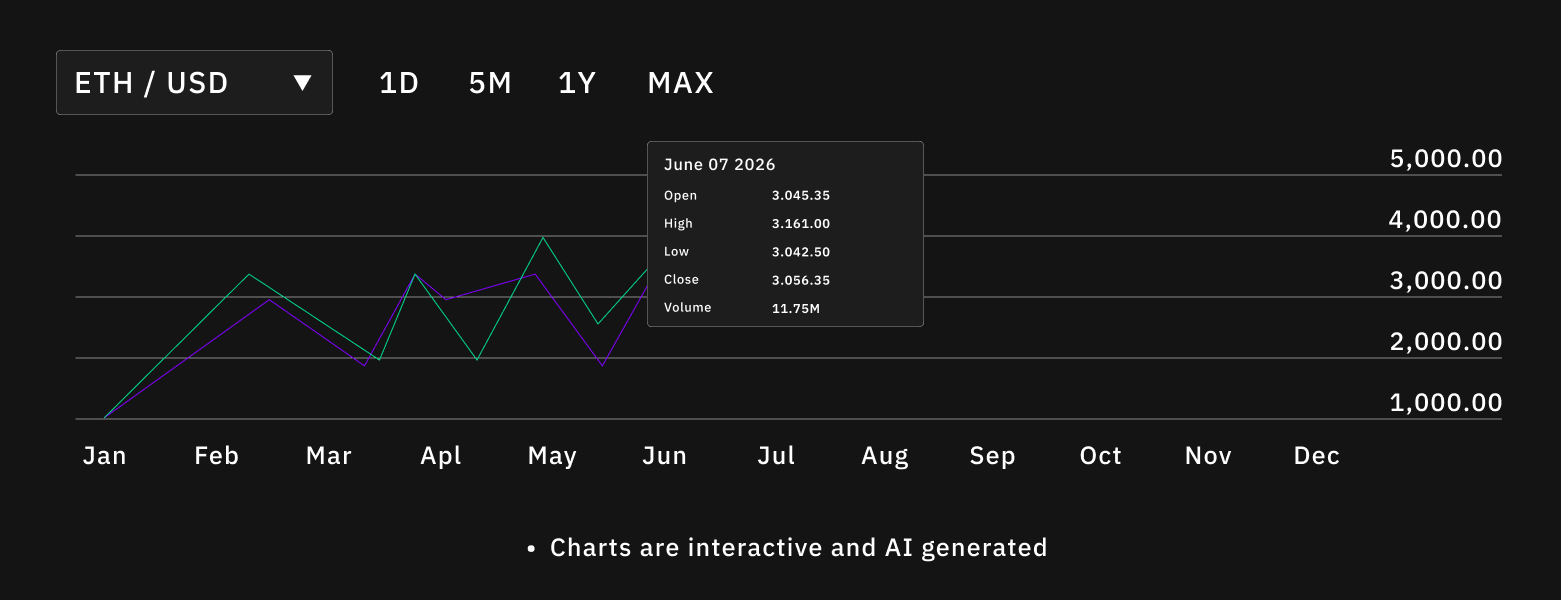
| Price Charts | Visualize token price movements across time. | • Multiple timeframes (hourly, daily, weekly) • Price comparisons across tokens • Volume overlays • Price alert visualization | • Trend analysis • Market timing • Price comparison across assets |
| Volatility Charts | Analyze price stability and market risk. | • Historical volatility tracking • Volatility trend comparisons • Risk visualization | • Risk assessment • Strategy planning • Identifying unstable assets |
| RSI (Relative Strength Index) | Evaluate market momentum using technical indicators. | • RSI calculations • Overbought and oversold zones • Historical RSI tracking | • Entry and exit timing • Momentum analysis • Trend confirmation |
| Volume Analysis | Understand trading activity and liquidity. | • Volume bars and trends • Price–volume correlation • Activity spikes detection | • Liquidity analysis • Market participation insights • Identifying accumulation or distribution phases |
| On-Chain Activity Visualizations | Visualize behavior directly from blockchain data. | • Transaction flow patterns • Wallet activity trends • Network-level metrics | • Network health analysis • Wallet behavior tracking • Pattern discovery across chains |
You can generate charts using natural language queries.
Example Requests:Price & volume:
- “Show me Bitcoin price for the last 30 days”
- “Compare ETH and SOL price movement”
- “Overlay volume on ETH price chart”
- “Show RSI for BTC”
- “Display volatility for Ethereum”
- “Compare top 5 tokens by volume”
- “Show correlation between BTC and ETH”